How Traefik Turns Kubernetes Changes Into Live Routing Updates
Let’s explore Traefik’s internal architecture and see how it integrates with Kubernetes to monitor changes and update request routing dynamically.
A simplified view of the main components involved in the routing of requests
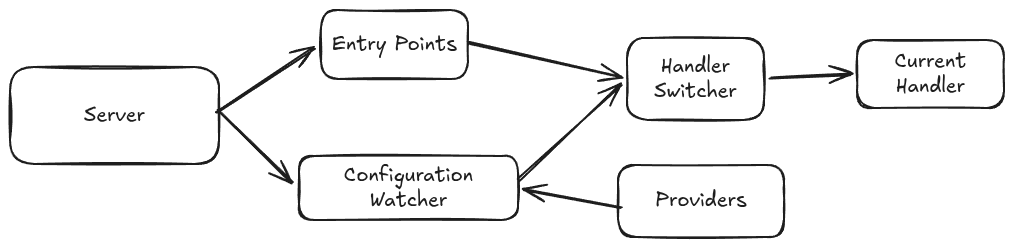
When the server starts, it initializes a set of entry points. Each entry point is a listening endpoint through which traffic enters Traefik. In simplified terms, an entry point contains:
- A listener that accepts incoming connections,
- A handler that processes requests and writes responses.
The next important components are the configuration watcher and the providers. A provider monitors a specific configuration source, for example: Kubernetes or Docker, and feeds the configuration watcher. The configuration watcher maintains a set of callbacks and calls them when a new configuration arrives. One of the callbacks updates the current handler through the handler switcher.
In the Kubernetes case, the provider uses the Kubernetes client and informers to observe changes in resources such as Ingresses, Services, EndpointSlices, Secrets, or Traefik CRDs. When a change is detected, the provider rebuilds the dynamic configuration and sends it through the configuration pipeline. The configuration watcher then propagates the update, and the handler switcher makes the new handler active for future requests.
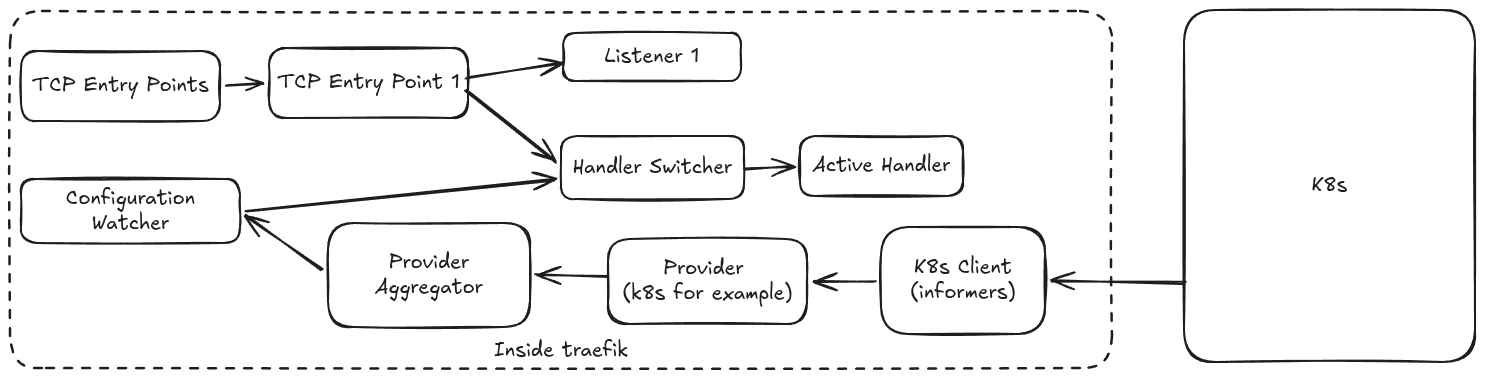
The second diagram shows a more detailed version of the interactions between the main components. The provider aggregator collects dynamic configuration updates coming from different providers and forwards them to the configuration update pipeline.
Traefik supports multiple provider types. pkg/provider/* contains providers such as HTTP, file, ECS, Docker, and others.
In the case of Ingress, Traefik uses Kubernetes informers to watch for the changes happening on the targeted objects.
When a relevant Kubernetes event is received, the provider rebuilds the corresponding configuration and sends it through the configuration channel to the configuration watcher.
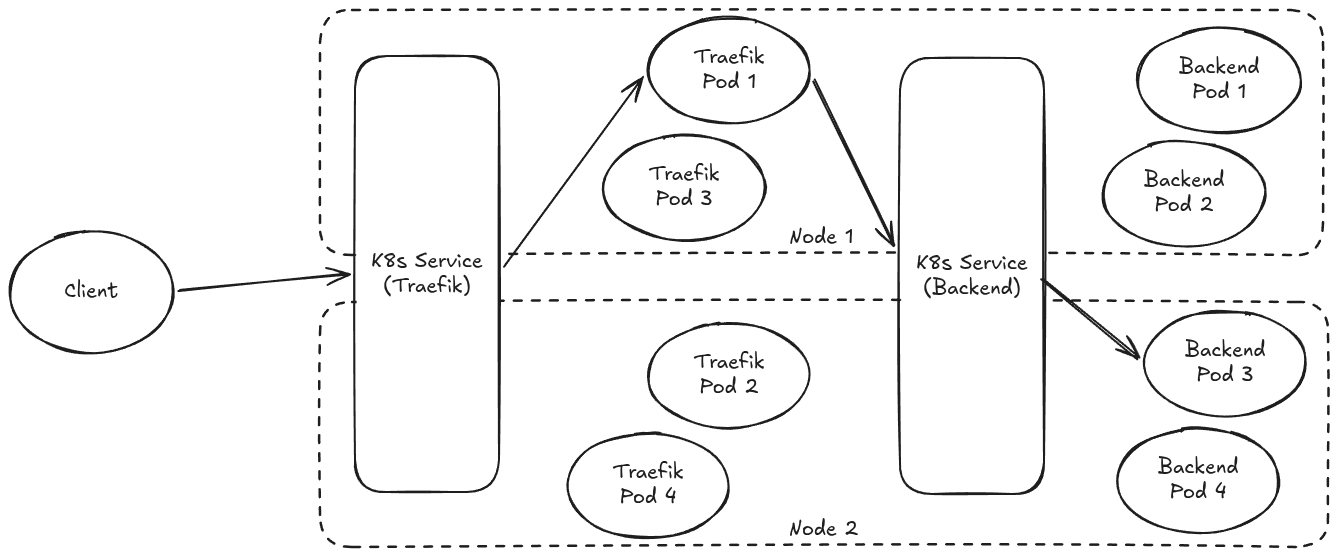 The last diagram illustrates an example of a possible path that a request will take from a client outside the cluster to reach the backend.
The client sends its request to a public IP address, or DNS name exposed for Traefik.
The IP address can be published through a cloud load balancer such as ELB, or software such as MetalLB.
The last diagram illustrates an example of a possible path that a request will take from a client outside the cluster to reach the backend.
The client sends its request to a public IP address, or DNS name exposed for Traefik.
The IP address can be published through a cloud load balancer such as ELB, or software such as MetalLB.
- The Traefik Service selects one of the available Traefik pods to receive the request
- Traefik receives the request and decides where to route it depending on the latest configuration updates received from Kubernetes.
- In this example, the next target is a backend Service. Traefik will forward the request to the IP address of the backend service.
- The backend Service then selects one of the available backend pods to receive the proxied request.
What happens when a new deployment is rolled out?
At the Kubernetes level:
- the old pods will be terminated and new pods will be created.
- the EndpointSlices are updated to reflect the new set of pods.
At the Traefik level:
- the Kubernetes provider receives new events through the informer/watch pipeline,
- it rebuilds the dynamic configuration that corresponds to the updated cluster state,
- that configuration is sent through Traefik’s configuration update pipeline,
- the configuration watcher propagates the update to its listeners,
- Traefik updates its active runtime routing state,
- new requests are then forwarded to the new backend pods without restarting the server.
The key idea is that Traefik separates request handling from configuration discovery. Kubernetes changes are observed through informers, translated into dynamic configuration, and then applied to the active runtime without restarting the server.