How Grafana Alloy Builds and Runs Its Component Graph
Why I Read Alloy
Recently, I explored several open-source projects like Traefik and Juju, and finally found Alloy. The project is under active development, written in my preferred programming language, Go, and widely deployed in production environments. It solves an interesting problem of observability and integration with many third-party projects like Prometheus, Loki, and Mimir. Alloy is part of the Grafana Labs ecosystem, which includes many open-source solutions for cloud-native applications, so I’m expecting the code to be clean and well-organized, with engineering as a top priority.
For those reasons, I have seen it as a natural continuation of my previous experience with CKAD, code exploration of Traefik, and my study of distributed systems with MIT 6.5840.
What does Alloy do?
From the documentation
Grafana Alloy combines the strengths of the leading collectors into one place. Whether observing applications, infrastructure, or both, Grafana Alloy can collect, process, and export telemetry signals to scale and future-proof your observability approach.
In other words, it’s a tool that you can use to collect all the telemetry signals, whether from the applications or the infrastructure. This collected data can be processed before being exported to third-party monitoring tools like Mimir or Loki.
Runtime overview
 At the heart of the application, there is a runtime (a controller) that coordinates the interactions between the different parts of the system. There are many moving parts in the runtime, so I decided to focus on a set that looked relevant to me. In this blog, I’ll omit the parts that I haven’t explored yet.
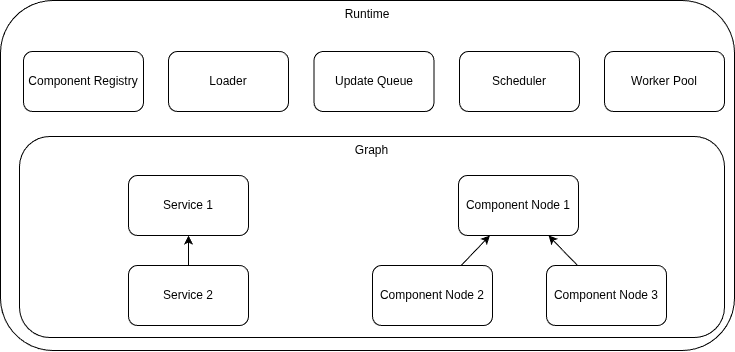
The controller has
- A loader: responsible for transforming configuration files to Go structures.
- A scheduler: responsible for running the services/components at startup.
- A worker pool: background goroutines for task execution.
- A queue: responsible for receiving the events/updates from the components.
- A graph: a data structure that represents the dependencies between components and services.
The controller has many other parts like the component registry, which is a data structure that grants quick access to the component code, but I decided to limit the list to those 5 elements.
Services and Components
Services
A service provides functionality to the runtime. Services are hardcoded, but their configurations can be altered using the configuration files. Some examples of services include:
HTTP service:
Creates an HTTP endpoint that the clients may use for:
- retrieving the tracing of Alloy
- checking components health
- retrieving debug information
- interacting with components that support interactions via HTTP
UI service:
a web UI with a GraphQL service.
Other services
- Cluster service
- Label service
- OTel service
- Remote Configuration service
Components
The components are the building blocks. Each block provides a single functionality. For example:
file_match: discovers files on the file systemloki.source.file: reads log entries from files and forwards them to other Loki componentsloki.write: receives log entries from other Loki components and sends them over the network.
The official documentation provides some examples of how to combine several components to create a functionality like collecting log entries and forwarding them to Loki.
Startup process: from configuration files to Go structures
During the startup process, the controller, through its different components, goes through the following steps:
- Load the configuration files’ content.
- Parse the configurations.
- Build the graph.
- Run the evaluation.
- Invoke the scheduler.
The graph structure is important; it represents the dependencies between the nodes. Each node represents a service, a component, or another structure not explored yet.
During the graph building, the process will start by populating the services, then the components. Once the graph is built, a validation will be run to make sure that no cycles exist.
The process walks through the graph nodes from leaves to roots. The leaves are the nodes that don’t depend on any other nodes. The process moves then to the parents of those leaves, after that, to the parents of the parents, and so on … until it reaches the root. A root is a node that only refers to other nodes, but no node refers to it.
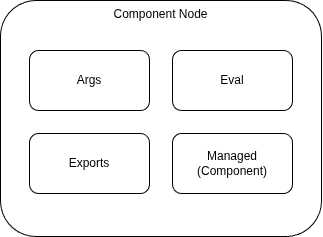
For each node, it’ll build the arguments passed to the node from the configuration file. In case of ComponentNode, those arguments will be used to create an instance of the referred component.
The graph construction process goes through several steps, as shown in the diagram:
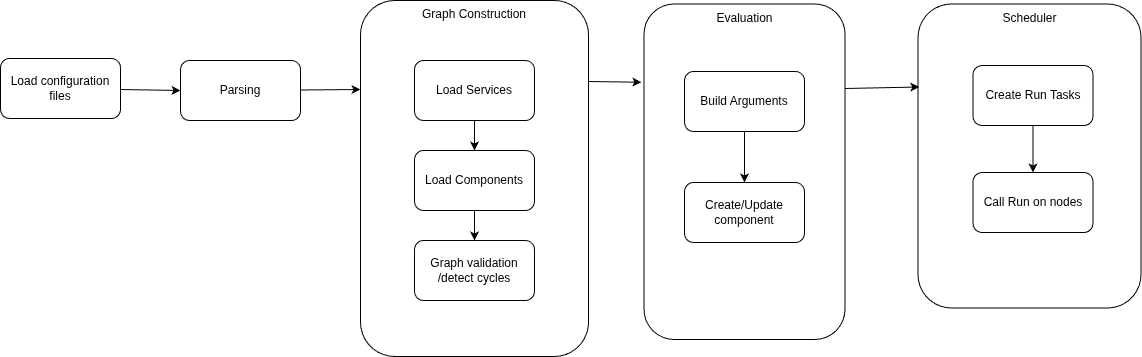
After the evaluation step, the only remaining step will be to call Run on every node of the graph. To do so, the runtime will use the scheduler to walk through the nodes, again from leaves to roots, to call the targeted method.
An example of a configuration file from the documentation:
local.file_match "local_files" {
  path_targets = [{"__path__" = "/var/log/*.log"}]
  sync_period = "5s"
}
loki.source.file "log_scrape" {
  targets    = local.file_match.local_files.targets
  forward_to = [loki.process.filter_logs.receiver]
  tail_from_end = true
}
loki.process "filter_logs" {
  stage.drop {
    source = ""
    expression  = ".*Connection closed by authenticating user root"
    drop_counter_reason = "noisy"
  }
  forward_to = [loki.write.grafana_loki.receiver]
}
loki.write "grafana_loki" {
  endpoint {
    url = "http://localhost:3100/loki/api/v1/push"
 }
}
Four components are invoked in the example:
local.file_match: finds the target files using a pattern, in this case: “/var/log/*.log”loki.source.file: loads the files matched in the previous componentloki.process: filters some linesloki.write: forwards the filtered data to a remote server
Simplified, the log processing pipeline can be read like this:
local.file_match -> loki.source.file -> loki.process -> loki.write
How Updates propagate
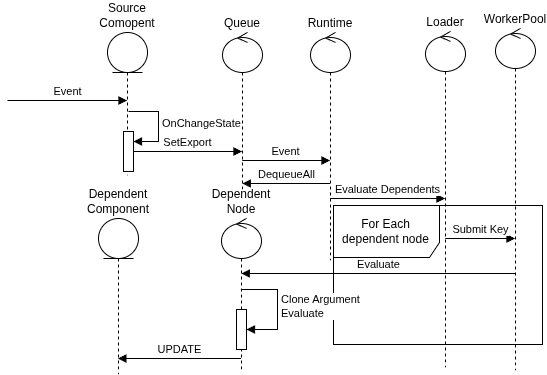
When a component detects a change, it reports the update to the runtime instead of communicating directly with dependent components. The component will create an event and push it to the queue managed by the runtime. Later, the runtime pulls updates in batches and submits them to the worker pool as tasks. For each task, a worker will run an evaluation on the dependent components to notify them about the event. The propagation always happens from nodes to their parents. The use of the graph will prevent notifying components about events that don’t interest them.
Conclusion
Reading Alloy helped me understand how a large Go project can organize configuration loading, dependency management, component lifecycle, and update propagation around a runtime graph.
I still skipped many parts, but the mental model is now clearer: Alloy parses configuration into nodes, builds a dependency graph, evaluates nodes from leaves to roots, starts them through the scheduler, and later uses the same graph to propagate updates.
My next step is to explore more services, especially clustering, labels, and remote configuration, then start looking at issues where this mental model can help.